Contents
- Index
- Previous
- Next
Graph Menu - Statistical Rankings
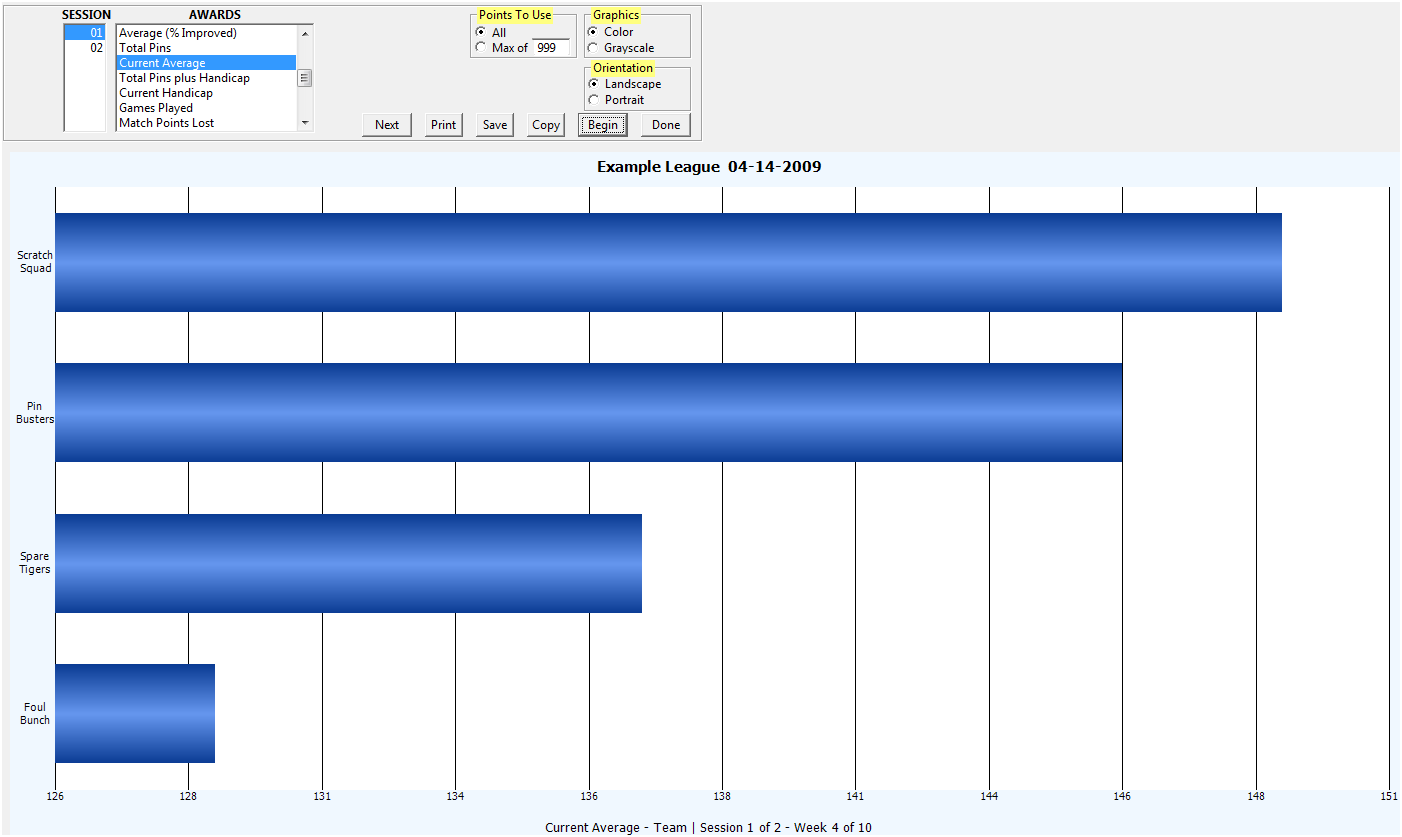
If you want a bar graph that orders all teams or players for a particular statistic, including the extra statistics, this is the graph to create. For example, this graph will allow you to print a bar graph of all the players ordered by their current playing average.
To create the graph you need to specify what you want graphed. On the screen below you can see that Session 1 and Current Average have been selected. You must make at least one selection for each item. However you can also select more that one item by holding down the Ctrl key and clicking on each item name in a list. You can also select a group of items by holding down the Shift key and clicking on the first item in the group and then the last item in the group. If you do not select the items needed to create a graph, nothing will happen when you click on the Begin button.
Points to Use: Some graphs will be too busy if all the points available are used for the graph. For example, you may want to list only the top 10% of the players on the rankings graph. If there are 80 players on the league, you might want to click on the Max of option and enter 8. The default is to use all the points for each graph.
Graphics: The default is to create the graphs in color. However, if you will be printing the graph on a monochrome, black and white printer, you may get better results with Grayscale instead of Color graphics.
Landscape or Portrait: Graphs sent to a printer can either be printed in portrait or landscape mode. The default is Landscape.
Done Button: Click on this button when you are done with the graphing. You will be returned to the main program screen.
Begin Button: Click on this button to begin creating the graphs you have specified. If nothing happens when you click this button, then you have not specified all the items the program needs to create a graph. You can see on the example below that Session 1 and Current Average have been selected.
Next Button: Click this button to bring up the next graph in a series. When all the graphs in the series have been created, this button will disappear.
Print Button: (registered version only) Click on this button to send the graph to the printer you have specified on setup from the main program Option menu.
Save Button: (registered version only) Click on this button to save the graph to a file (JPG or PNG). A dialog box will pop up asking you for the file location and name.
Copy Button: (registered version only) Click on this button to copy the graph to the clipboard. You can then paste it in another document such as an Email or a word processing document.